目錄
- 一�����、prometheus基本原理介紹
- 二����、prometheus使用docker部署
- 三�����、prometheus整體架構(gòu)及各組件
- 四、prometheus客戶端調(diào)用示例
一��、prometheus基本原理介紹
prometheus是基于metric采樣的監(jiān)控�����,可以自定義監(jiān)控指標,如:服務每秒請求數(shù)��、請求失敗數(shù)�、請求執(zhí)行時間等����,每經(jīng)過一個時間間隔�����,數(shù)據(jù)都會從運行的服務中流出�����,存儲到一個時間序列數(shù)據(jù)庫中�,之后可通過PromQL語法查詢����。
主要特點:
多維數(shù)據(jù)模型��,時間序列數(shù)據(jù)通過metric名以key��、value的形式標識��;
使用PromQL語法靈活地查詢數(shù)據(jù)�;
不需要依賴分布式存儲�����,各服務器節(jié)點是獨立自治的����;
時間序列的收集,通過 HTTP 調(diào)用,基于pull 模型進行拉取;
通過push gateway推送時間序列��;
通過服務發(fā)現(xiàn)或者靜態(tài)配置�,來發(fā)現(xiàn)目標服務對象�;
多種繪圖和儀表盤的可視化支持;
二�����、prometheus使用docker部署
查看是否有鏡像
sudo docker search prometheus
新建prometheus.yaml
global:
scrape_interval: 10s
evaluation_interval: 60s


scrape_configs:
- job_name: prometheus
static_configs:
- targets: ['localhost:9090']
- job_name: integral
static_configs:
- targets: ['10.20.xx.xx:8001']
執(zhí)行:
docker run --name prometheus -p 9090:9090 -v ~/prometheus.yaml:/etc/prometheus/prometheus.yml prom/prometheus
進入容器中可以看到配置文件已映射到容器指定目錄:
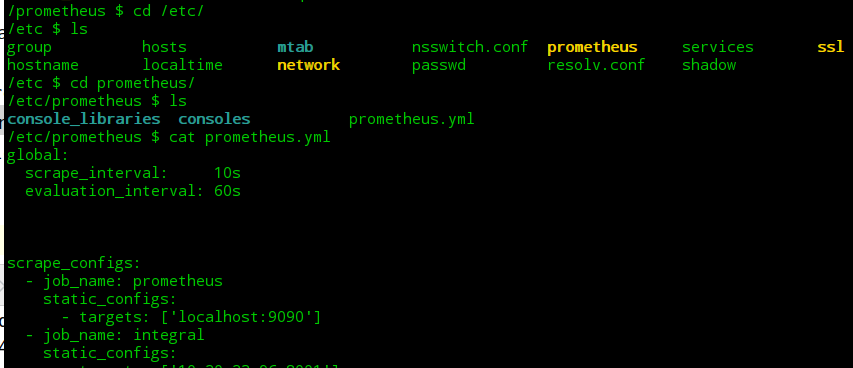
踩坑: prometheus官方鏡像指定的配置文件是prometheus.yml 所以映射到容器內(nèi)的文件名一定要保持一致 否則會出現(xiàn)指定的配置文件不生效
三����、prometheus整體架構(gòu)及各組件
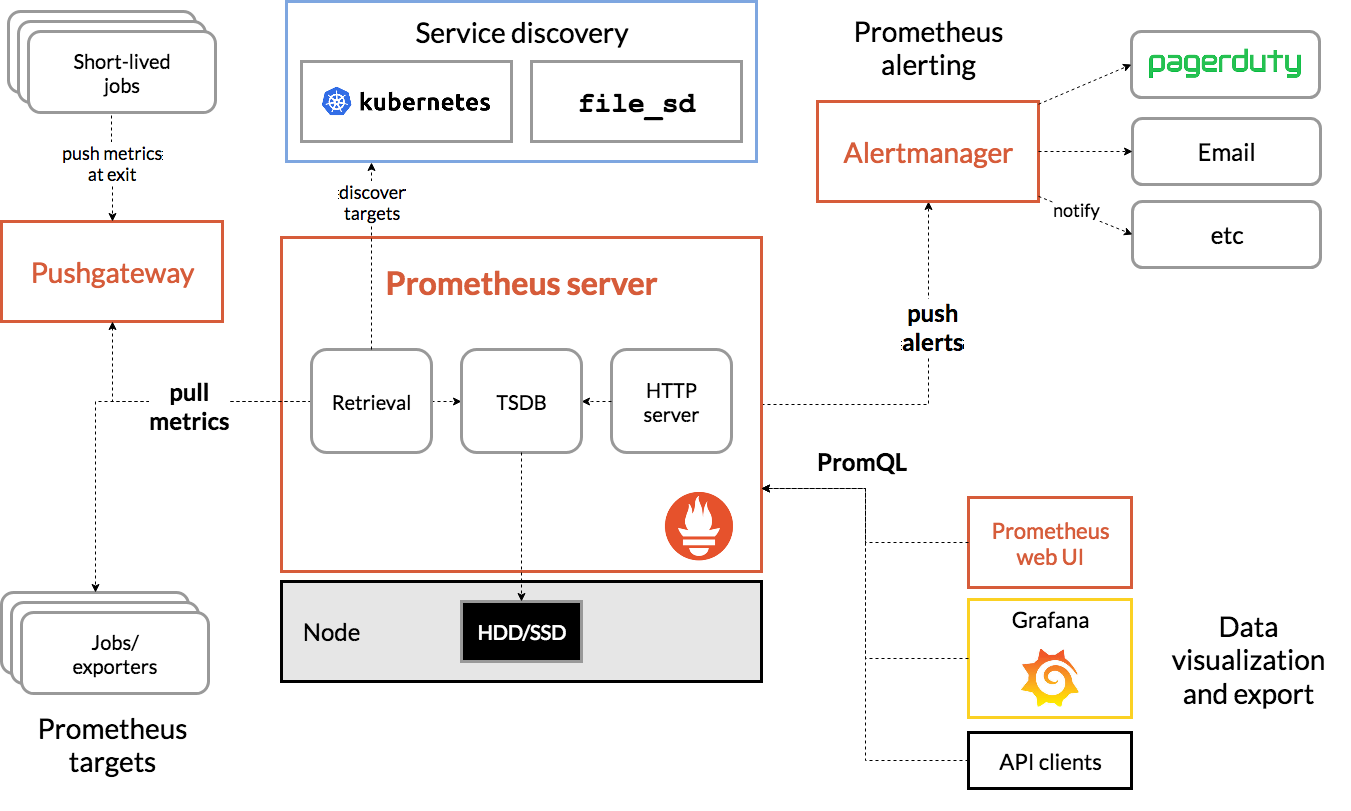
Prometheus Server :主程序,負責抓取和存儲時序數(shù)據(jù)�;
Client Libraries:客戶端庫��,負責檢測應用程序代碼���;
Push Gateway:Push 網(wǎng)關(guān),接收短生命周期的 Job 主動推送的時序數(shù)據(jù)���;
Exporters:為不同服務定制的Exporter(如:HAProxy��、StatsD�����、Graphite等) ,從而抓取它們的Metris指標數(shù)據(jù)����;
Alert Manage:告警管理器,處理不同的告警��;
四��、prometheus客戶端調(diào)用示例
自定義prometheus的gin中間件
package ginprometheus

import (
  "strconv"
  "sync"
  "time"

  "github.com/gin-gonic/gin"
  "github.com/prometheus/client_golang/prometheus"
)

const (
  metricsPath = "/metrics"
  faviconPath = "/favicon.ico"
)

var (
  // httpHistogram prometheus 模型
  httpHistogram = prometheus.NewHistogramVec(prometheus.HistogramOpts{
    Namespace:  "http_server",
    Subsystem:  "",
    Name:    "requests_seconds",
    Help:    "Histogram of response latency (seconds) of http handlers.",
    ConstLabels: nil,
    Buckets:   nil,
  }, []string{"method", "code", "uri"})
)

// init 初始化prometheus模型
func init() {
  prometheus.MustRegister(httpHistogram)
}

// handlerPath 定義采樣路由struct
type handlerPath struct {
  sync.Map
}

// get 獲取path
func (hp *handlerPath) get(handler string) string {
  v, ok := hp.Load(handler)
  if !ok {
    return ""
  }
  return v.(string)
}

// set 保存path到sync.Map
func (hp *handlerPath) set(ri gin.RouteInfo) {
  hp.Store(ri.Handler, ri.Path)
}

// GinPrometheus gin調(diào)用Prometheus的struct
type GinPrometheus struct {
  engine *gin.Engine
  ignored map[string]bool
  pathMap *handlerPath
  updated bool
}

type Option func(*GinPrometheus)

// Ignore 添加忽略的路徑
func Ignore(path ...string) Option {
  return func(gp *GinPrometheus) {
    for _, p := range path {
      gp.ignored[p] = true
    }
  }
}

// New new gin prometheus
func New(e *gin.Engine, options ...Option) *GinPrometheus {
  if e == nil {
    return nil
  }

  gp := GinPrometheus{
    engine: e,
    ignored: map[string]bool{
      metricsPath: true,
      faviconPath: true,
    },
    pathMap: handlerPath{},
  }

  for _, o := range options {
    o(gp)
  }
  return gp
}

// updatePath 更新path
func (gp *GinPrometheus) updatePath() {
  gp.updated = true
  for _, ri := range gp.engine.Routes() {
    gp.pathMap.set(ri)
  }
}

// Middleware set gin middleware
func (gp *GinPrometheus) Middleware() gin.HandlerFunc {
  return func(c *gin.Context) {
    if !gp.updated {
      gp.updatePath()
    }
    // 過濾請求
    if gp.ignored[c.Request.URL.String()] {
      c.Next()
      return
    }

    start := time.Now()
    c.Next()

    httpHistogram.WithLabelValues(
      c.Request.Method,
      strconv.Itoa(c.Writer.Status()),
      gp.pathMap.get(c.HandlerName()),
    ).Observe(time.Since(start).Seconds())
  }
}
gin路由初始化prometheus��,使用中間件采樣
gp := ginprometheus.New(r)
r.Use(gp.Middleware())
// metrics采樣
r.GET("/metrics", gin.WrapH(promhttp.Handler()))
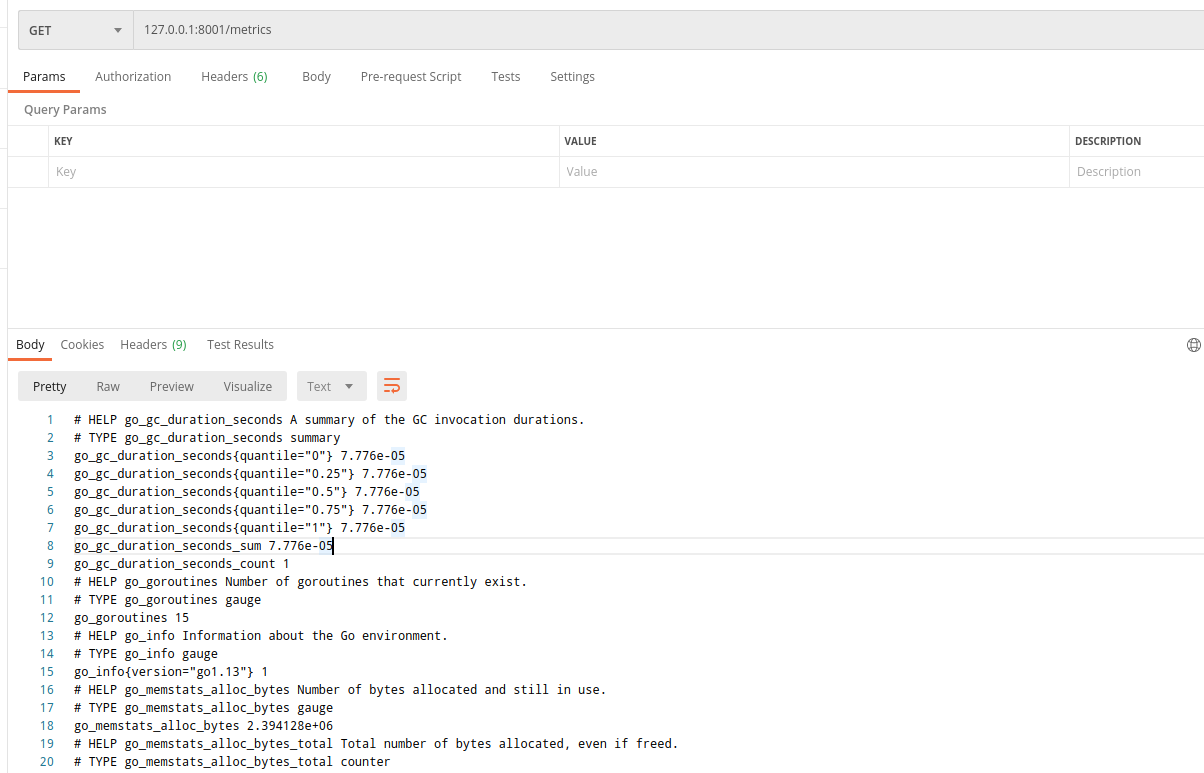
查看target
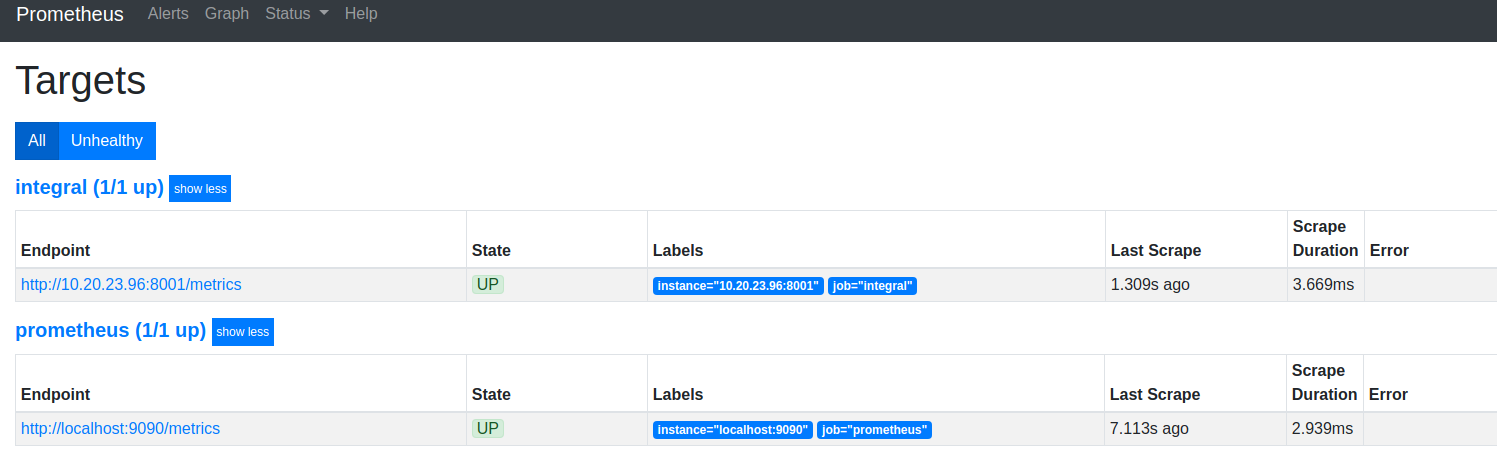
選取指標對應的graph��,這里以gc采樣的時間為例:
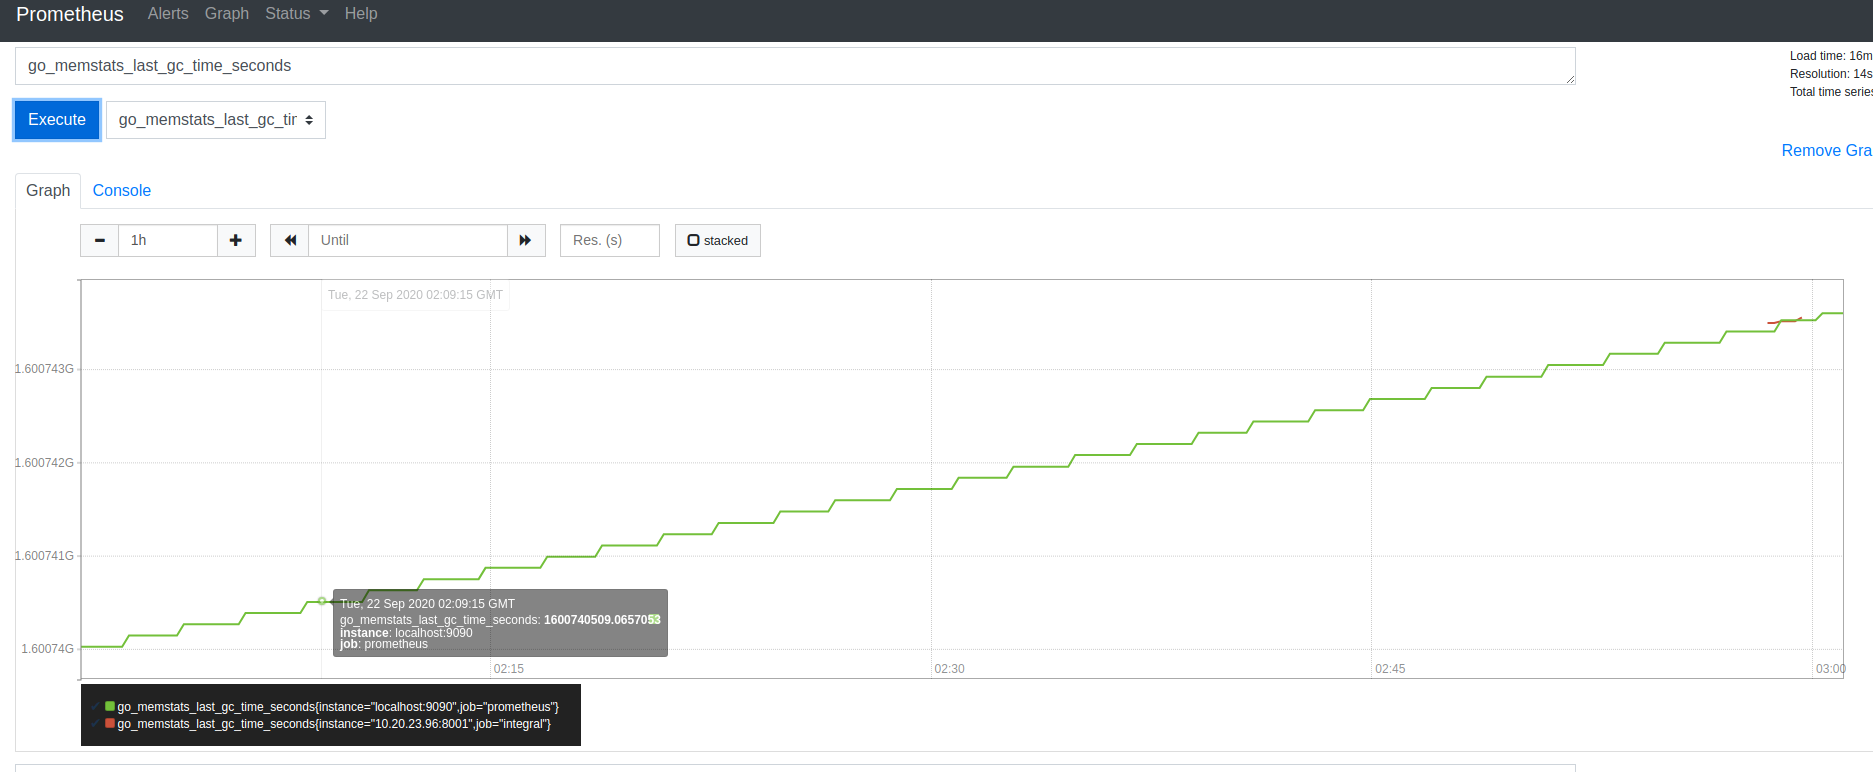
如果需要展示更為豐富的可視化看板,可以將prometheus與grafana結(jié)合���,將prometheus數(shù)據(jù)接入到grafana中�����,此處不再過多闡述
到此這篇關(guān)于詳解prometheus監(jiān)控golang服務實踐記錄的文章就介紹到這了,更多相關(guān)prometheus監(jiān)控golang服務內(nèi)容請搜索腳本之家以前的文章或繼續(xù)瀏覽下面的相關(guān)文章希望大家以后多多支持腳本之家����!
您可能感興趣的文章:- 如何基于Python和Flask編寫Prometheus監(jiān)控
- springboot集成普羅米修斯(Prometheus)的方法
- Java 用Prometheus搭建實時監(jiān)控系統(tǒng)過程詳解
- 使用 prometheus python 庫編寫自定義指標的方法(完整代碼)
- 使用prometheus統(tǒng)計MySQL自增主鍵的剩余可用百分比
- 使用Prometheus+Grafana的方法監(jiān)控Springboot應用教程詳解
- 使用Grafana+Prometheus監(jiān)控mysql服務性能
- 利用Prometheus與Grafana對Mysql服務器的性能監(jiān)控詳解
- Prometheus開發(fā)中間件Exporter過程詳解